Home Personal Projects OSU Projects Element 1 Projects Videos
Integrated Test Stand
A Computer Science Capstone Project for Oregon State University – Cascades
Group members: Ben Foley, Eric Johnson, Seth Weiss
Project Partner: Element 1
Spring 2024
Jump To
Intro
What is The Integrated Test Stand? It’s our year-long project in which we (Ben, Eric, and Seth) developed a synthesized data logging program for our project partner, Element 1. Previously, E1 had been logging performance data from different devices in separate locations and then spending valuable time manually combining them for analysis. Our project integrates three of these main devices and synthesizes the data logging so they can spend more time analyzing performance and less time doing busy work in Microsoft Excel. As a bonus, we also designed and built a graphical user interface (GUI) for the engineers to more easily monitor the live data and interact with the logging process.
This blog post serves as a public landing page for the project. The reason we are writing a blog post rather than making an official website full of fancy marketing images and information is that our project is under NDA, uses a private GitHub repository, and is exclusively intended for use by the engineers at Element 1. So rather than focusing on the selling points of our project, we want to emphasize our development journey. In addition to sharing our results with you, we want to explain how we got there and what we learned along the way.
 The Integrated Test Stand team. From left to right: Ben Foley, Seth Weiss, Eric Johnson.
Background
Element 1 is a company in Bend, Oregon that designs and fabricates small-scale hydrogen reformers. The reformers take a methanol feedstock, heat it up well beyond its vaporization point, and perform a series of proprietary filtration processes to separate the pure hydrogen gas from the rest of the gaseous mixture. The pure hydrogen then exits the reformer where it can be fed into a compressor for storage or used in whatever application is desired.
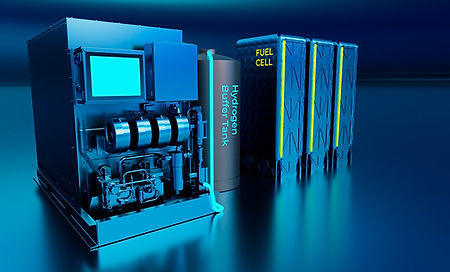
Element 1 designs and fabricates the hydrogen reformers (left) which can be attached to a buffer tank (center) and subsequent storage devices (right).
The main products that Element 1 sells are actually the technology and design as well as the license to manufacture the reformers. Because of this, the company is heavily focused on R&D and they run a lot of performance trials. These trials utilize a number of flow meters and sensors to gather essential data and performance metrics. Three key devices used in these metrics are a Coriolis flow meter which measures various properties of the methanol feedstock, an Alicat flow controller which measures various properties of the hydrogen output as well as controls the flow rate, and a CAN bus known as the LECM (large engine control module) which monitors a number of internal sensors (pump speeds, reactor temperatures, etc.).
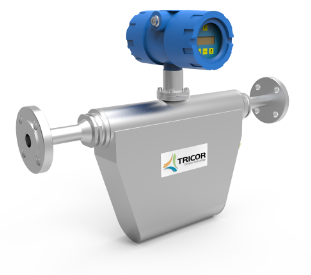
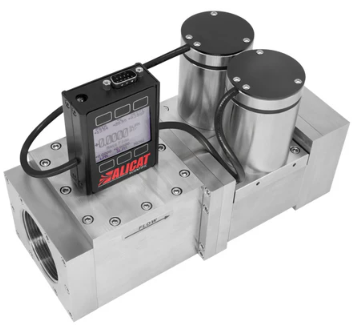
The Coriolis flow meter (left) measures the flow rate (among other aspects) of the incoming methanol feedstock. The Alicat flow controller (right) measures various aspects of the hydrogen output as well as restricts and controls the outgoing flow rate.
The engineers at Element 1 have historically been logging data from the different devices in separate locations and spending valuable time to manually combine them for analysis. Rather than continue this process, they decided to come to us and partner in our Capstone project to build a synthesized logging program. Because the engineers also value the ability to view live data during these performance runs, we decided to include a graphical user interface (GUI) for them to monitor key performance indicators (KPIs) alongside the logging (not everyone loves the command line as much as CS students!).
Process
The development process can be broken down into four main sections, one of which was organizational, and three of which were hands-on. The hands-on phases are (1) the physical wiring and establishing communication of the devices, (2) developing the backend synthesis and data logging program, and (3) implementing and polishing the GUI. These phases were preceded with a documentation and design phase in which we established the ground rules and expectations of the project. The results of this phase were a number of official documents including a Product Requirements Document (PRD), Software Design Architecture (SDA), and Software Development Process (SDP). It’s important to emphasize the “living” aspect of these documents, as we wanted to give ourselves enough flexibility to adapt and change the project design and requirements as needed. Indeed, although a significant portion of the design phase preceded the physical wiring stage, the design process was something that iteratively returned throughout the entire year. In a sense, it is not really separate from the three hands-on phases, it just started before them and continued throughout the project.
We did not strictly follow software engineering development flows such as Agile or Scrum. However, this iterative process of constantly reevaluating and refining our goals is somewhat related to these techniques. We were told by a guest lecturer that Agile is actually more of a mentality than a process flow, so in that sense maybe we were actually practicing Agile all along and didn’t realize it.
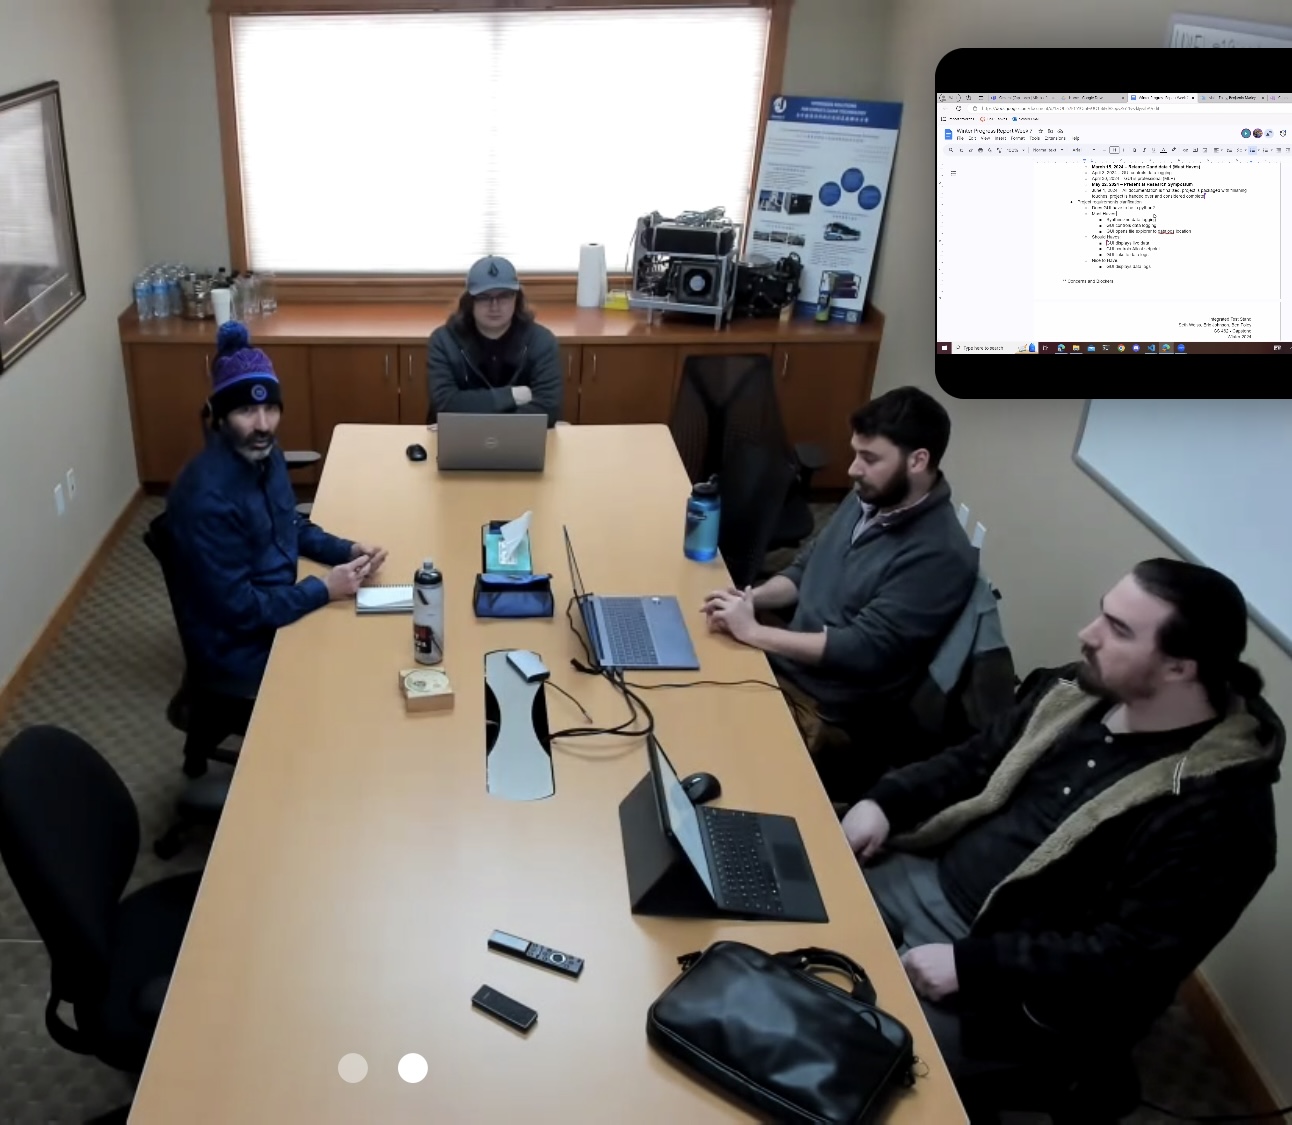
Our weekly meeting with our project partner was held onsite at Element 1 where we covered our recent accomplishments and goals as well as asked clarifying questions and notified of blockers and obstacles. (Photo credit to Kirsten Winters, our Capstone faculty advisor, who sat in on this particular meeting remotely).
An aspect of Scrum that we always hear about is weekly stand-ups. We did not do this. However, we did have two weekly meetings. One was specifically for our group in which we discussed what we completed the previous week, what we intended to do during the current week, and what we hoped to get to in the following week. The other weekly meeting included our project partner. This meeting involved progress updates as well as an opportunity to ask clarifying questions about project design, functionality, or troubleshooting assistance. These project partner meetings were held on site at Element 1 and we often stayed after the meeting to work on the reformer itself or to test our progress on the live system. So while we may not be explicitly implementing Scrum, we were pulling influence from its techniques of weekly updates and iteration.
Design
The first few weeks of the project allowed us to practice some professional skills. Most of our Computer Science careers at OSU - Cascades have involved an instructor giving us an assignment with a rubric that we try to meet. This project, on the other hand, forced us to have meaningful discussions with our project partners about what their needs are and what we realistically believed we could complete given the allotted time frame of one academic year.
Through these discussions, we developed a list of Must Haves, Should Haves, and Could Haves (known by the awkward acronym: MoSCoW prioritization). The key parts of our MoSCoW are as follows:
Must Have:
- Communication between all devices
- Synthesized Data Logging
- Implemented in Python
Should Have:
- Graphical User Interface (GUI) to display live KPI data points
- Control of the Alicat setpoint through the GUI
Could Have:
- Embedded views of data logs
- Graphs and charts based on data logs
Won’t Have:
- Remote access (ability to log in from remote devices)
As mentioned above, this list iteratively changed over the course of the year as we encountered various challenges, discovered new considerations, and came up against deadlines. New Must Haves, Should Haves and Could Haves emerged, various points shifted back and forth between the Should Haves and Could Haves, and eventually we agreed on a set of Should Haves and decided the Could Haves would not be completed as part of the project.
Physical Wiring
After we had established a solid set of expectations we began to research into the devices that we would be connecting and taking notes on how they were (or could be) integrated into the system. Because the design phase was such an iterative process, it overlapped significantly with this stage of the project.
Hoping to reduce the amount of wires and connections, we decided to attach the two external devices (Coriolis flow meter and Alicat flow controller) to a BRX Programmable Logic Controller (PLC). This BRX was the centerpiece of a data acquisition box (DAQ box) to which the Coriolis flow meter was already connected. Connecting the Alicat to the BRX involved cutting and crimping new wires for power and serial communication. We would then connect the BRX to the Controls computer, a Windows 11 desktop computer that sits next to the hydrogen reformer and QA/QC equipment. This Controls computer would also run the synthesizing program and GUI that we would end up building.
Cutting and Crimping
The first order of business was cleaning up the DAQ box and making room for the new connections. The idea was to add an Ethernet switch to it so that we could connect it to our network. Prior to this new switch, the only Ethernet port on the BRX was being taken up by the HMI (human-machine interface) of the DAQ box. To do this, we had to install a longer DIN rail (essentially a mounting bracket), shift a few of the terminals and fuses around, and cut/crimp new wires so that everything fit nice and neat. We also had the fabrication team drill a couple holes in the side of the DAQ box and install special ports so our connections could cleanly exit the box while the door was closed. One of these ports was for the Ethernet cable that would attach to the rest of the network and connect the BRX with the Controls computer. The other port allowed our new serial cable from the Alicat to connect to the BRX.
 The inside of the DAQ box as we neared completion of the physical wiring phase.
Creating a new cable for the Alicat was actually quite enjoyable. The serial cable that the Alicat takes is a bundle of wires, each with a different color and purpose. We split one of the ends of the cable and grouped the specific colors we were interested in: two for power that would connect directly to the reformer, and two the serial communication between the Alicat and the BRX. We folded the unused wires back along the cable and sealed them with special shrink wrap to keep them secure and out of the way. We then took our two pairs of wires and attached each of them to a Deutsch connector, a special plug that forms a waterproof seal when securely connected with its reciprocal socket. The connector for the power wires clipped right back into the corresponding connection on the reformer. The connector associated with our new serial wires connected to an extension cable that we made so that we could reach the DAQ box from the other side of the reformer if necessary. Only one side of this extension had a corresponding Deutsch connector for our Alicat cable. The other side was crimped and secured directly into a terminal on the BRX.
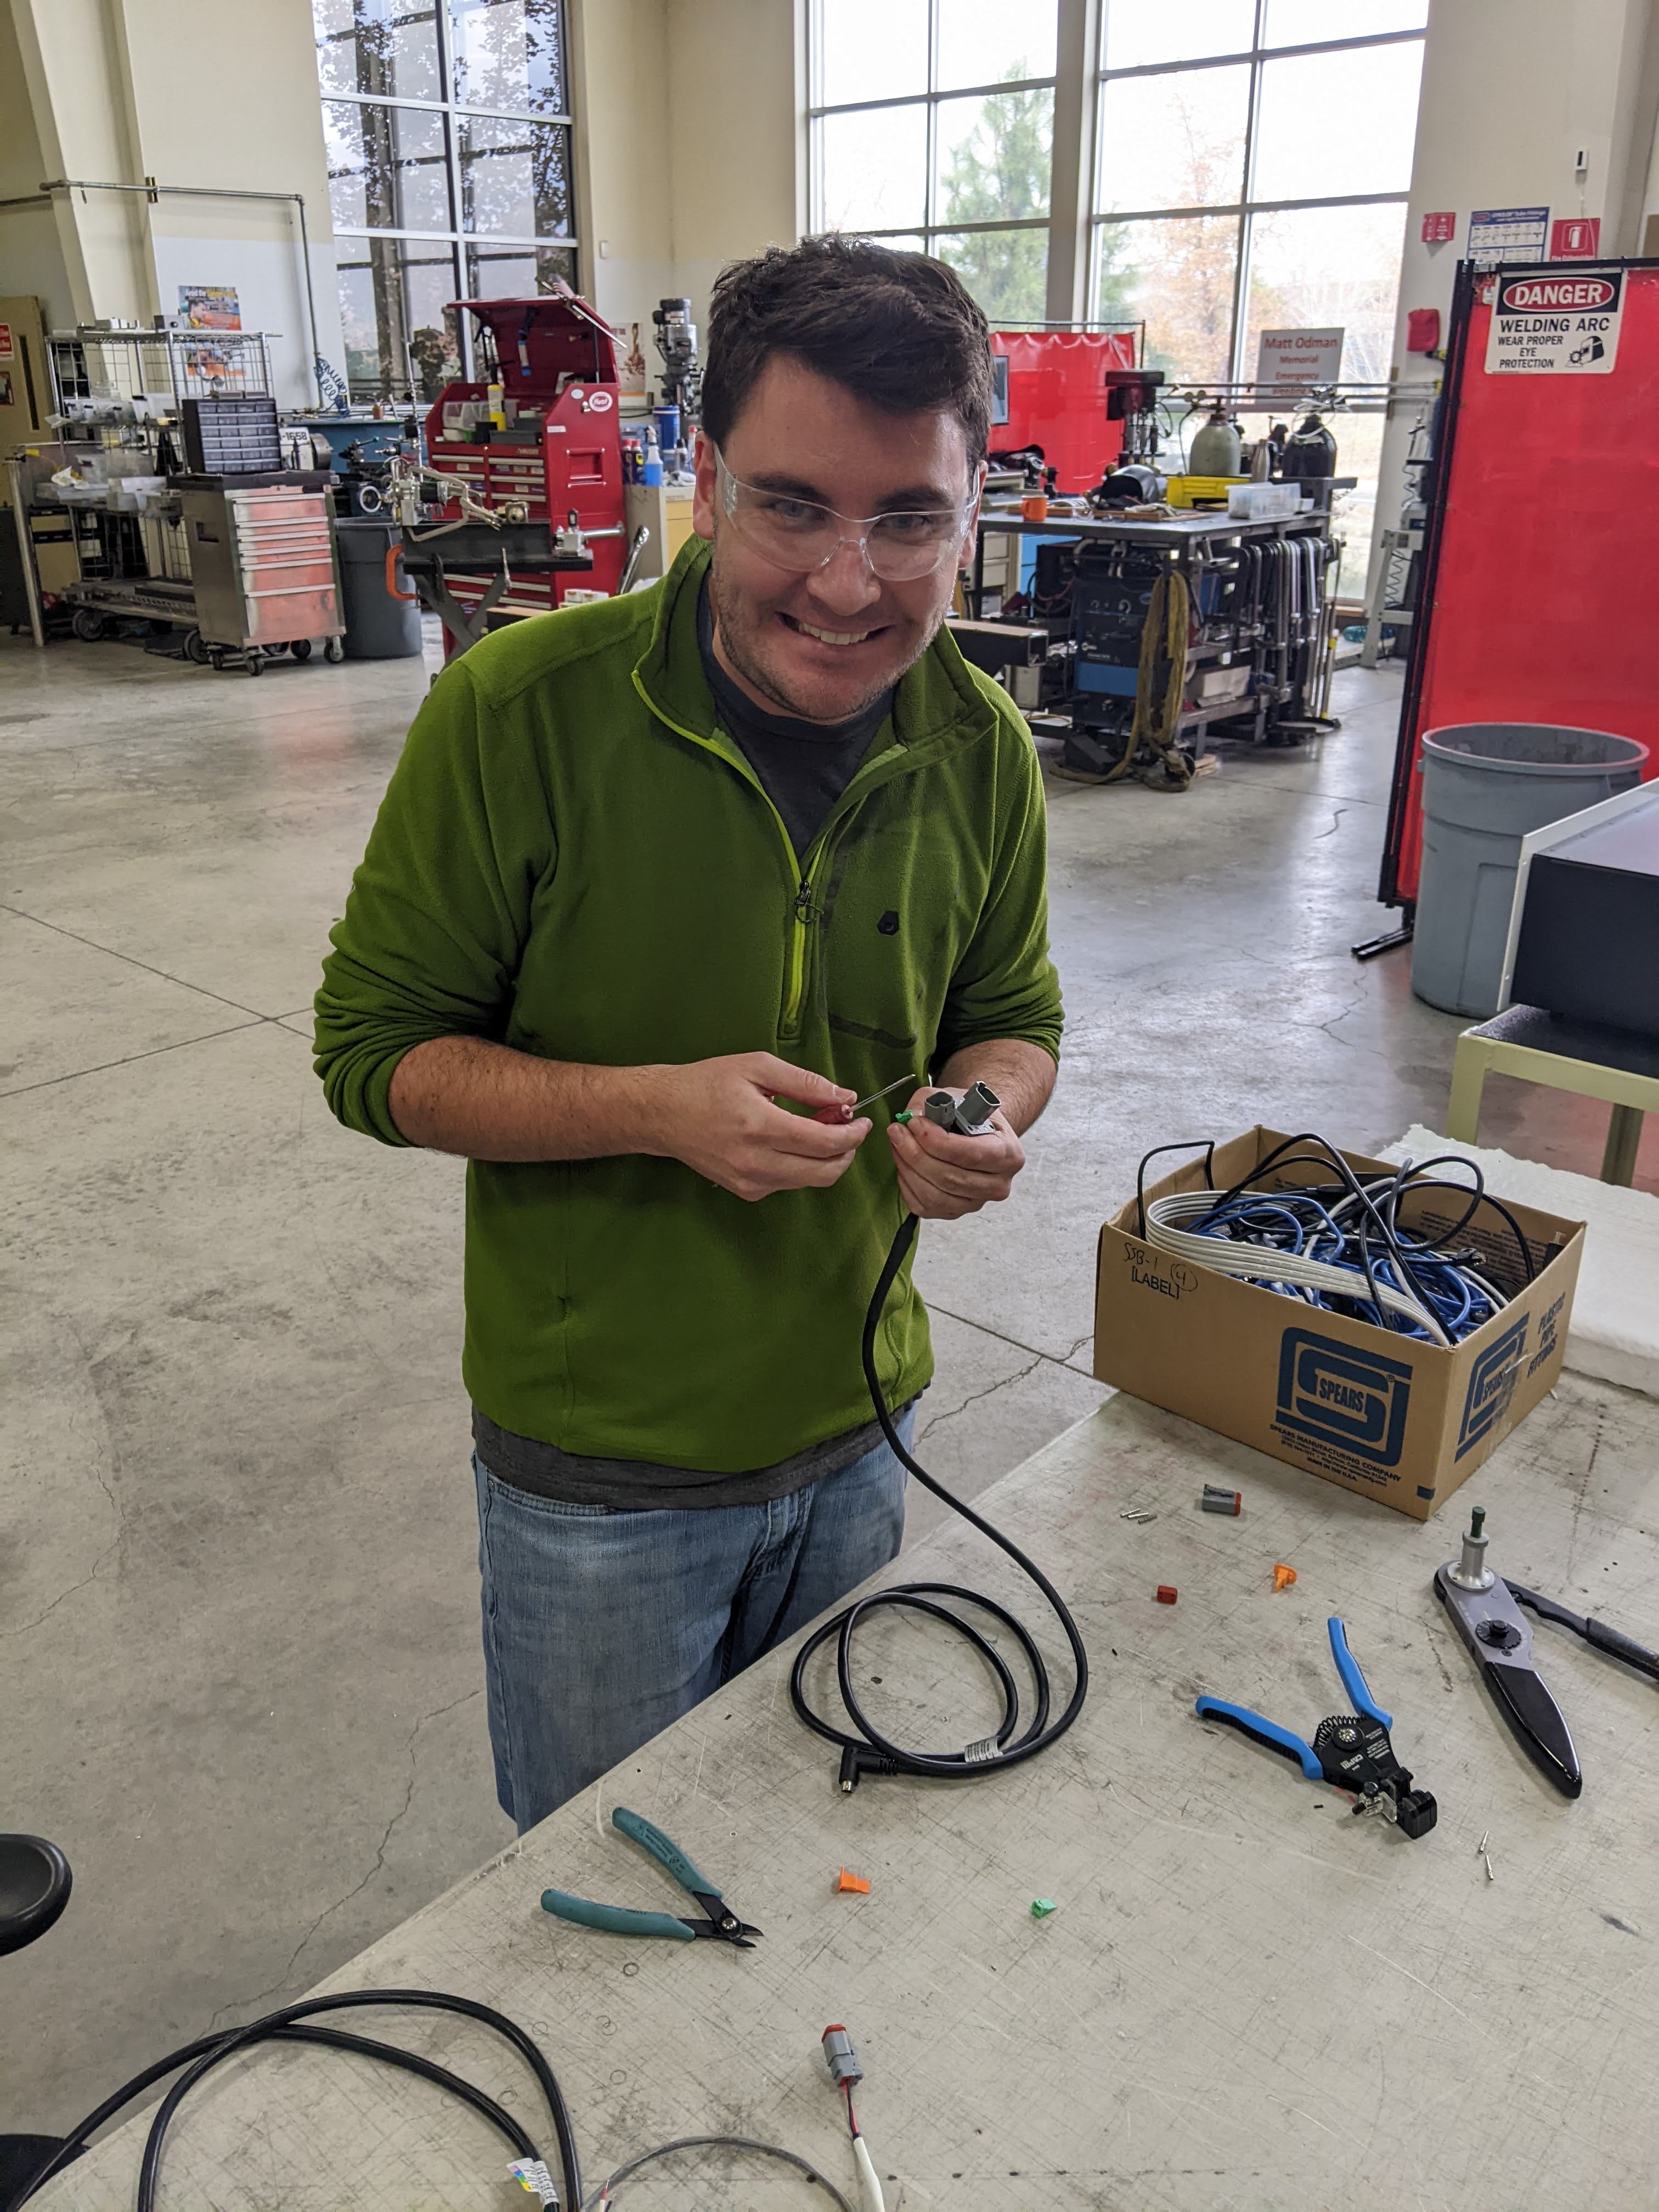
Ben was really excited about cutting and crimping new wires to connect these devices. It allowed us to explore the interface between hardware and software, rather than focus on the software like so many other Computer Science students.
Confirming Data Connectivity
With the Alicat and the Coriolis wired up to the BRX, it was time to connect the BRX to the Controls computer via Ethernet and begin to try to read accurate data from the devices. Previously, the BRX was recording all logs to its own memory. This was an option that we discussed for our project, but we decided logging the data on the Controls computer would be a better long-term solution.
After some initial IP issues, we began to update the BRX software so that it would accurately read the data from the Alicat. We then spent several weeks trying to understand the protocol that the Alicat uses to send out information. We spent a significant amount of time trying to read the Alicat data via Modbus protocol. We chose Modbus at first because, according to Wikipedia, it is “a de facto standard communication protocol for communication between industrial electronic devices in a wide range of buses and network[s].” We were able to read some, but not all of the data points specified by our project partner. We eventually came to the realization that we had two choices: (1) continue to struggle and risk wasting valuable time that we could be developing the logging program, or (2), scrap everything we had done over the last 3 or so weeks and start anew with trying to get data from the Alicat using the ASCII protocol. We gave ourselves until the end of the week to make the decision, and we ended up choosing to switch directions and attempt ASCII. Lucky for us, using the ASCII protocol only took a couple days to get working correctly!
With the Controls computer accurately reading data from the two flow meters via the BRX, we now only needed to tap into the LECM’s CAN bus. CAN stands for control area network and it is a standard for efficient communication between electronic devices. Without getting too far into the details, every device on the network can both send its status out, and receive the status of all the other devices. The nice part is that if your device is plugged in, it can communicate, if it’s not, the network doesn’t care. Therefore tapping into the CAN bus of the LECM proved to be fairly straightforward, especially since Element 1 already had the necessary hardware readily available. We used an existing Deutsch connector to run a cable from the CAN bus to a device called a Kvaser CAN to USB converter, which does exactly what the name suggests: it converts the CAN signals to a format recognized by the USB outlet on the other side which we could plug into our Controls computer.
Unfortunately, reading accurate CAN bus data from the LECM wasn’t as simple as plug-and-play. We experienced several issues decoding the CAN messages using some software taken from another E1 project. Eventually we realized that most of these decoding issues were stemming from the fact that we were using the wrong .dbc file (a file that basically holds the map of how to decode all the signals of a specific CAN bus). Once we included the correct .dbc file and modified our J1939Decoder class we were able to confirm accurate transfer of LECM data we were ready to synthesize and log all the data in one place.
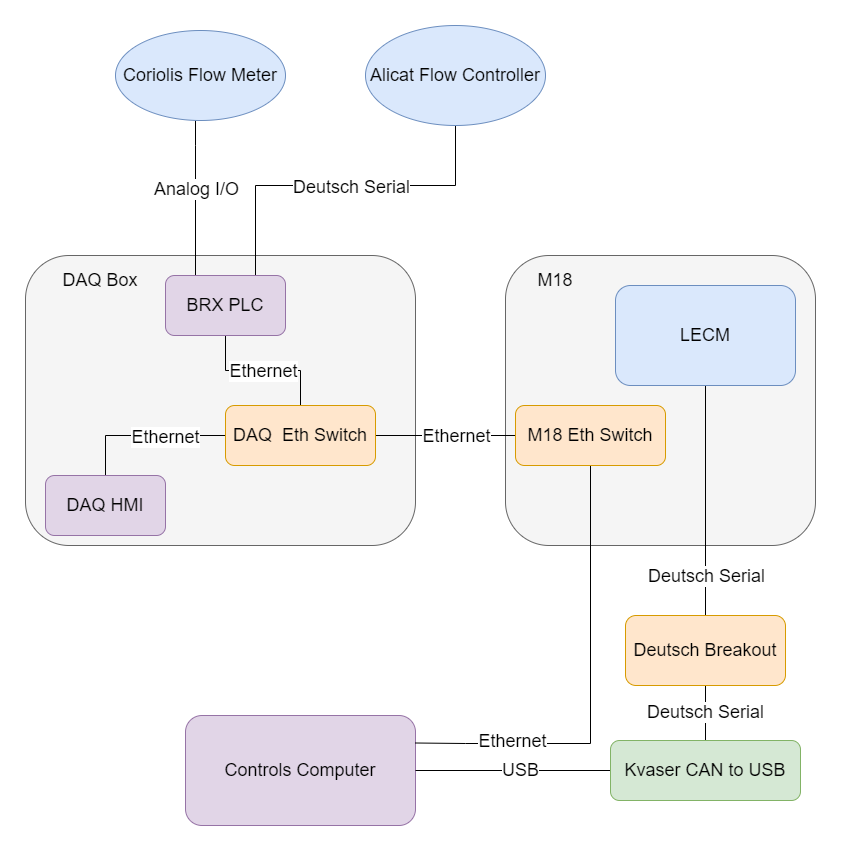
Diagram of the physical wiring network used to connect the devices. M18 is the specific model of hydrogen reformer that we focused our project on.
Backend Data Synthesis and Logging
Similar to how the design phase overlapped with the physical wiring phase, so did the physical wiring and the backend synthesis and data logging phases. This was done partly for time efficiency, and partly because it allowed us to better confirm that we were getting the correct data out of the devices as we wired the network together. The three of us each had our own schedules that we had to balance in addition to finding time at Element 1 where we could work onsite without getting in the way of their normal operations. Because of this, we used a BRX simulation program and created “dummy data” that we could work with remotely. This allowed us to start developing the backend program before we had finished physically wiring the network. In fact, by the time we were able to confirm accurate data transfer from the LECM to the Controls computer, we simultaneously achieved our milestone of synthesized data logging.
The backend synthesis and logging portion of the project took many forms throughout the development process. At first, it hosted a TCP server and the BRX acted as a client that would connect and send data to it. Connection issues soon made us realize that hosting the TCP server on the BRX and making the python program act as the client would be much more stable. With more design iterations, we determined that the BRX (and CAN bus) would be sending out data at different rates than what was desired for logging. With this consideration in mind, the python program then evolved to employ functional decomposition through multithreading. Functional decomposition is a type of parallel programming that uses separate threads to control separate operations. The threads are allowed to have access to shared data, but are ultimately only concerned with their own jobs. Using this technique, we were able to set the data logging on a separate schedule than the data coming in over the device connections.
 Software Architecture Diagram of the Integrated Test Stand.
The final form that the software architecture ended up taking is shown in the diagram above. Each data stream has its own connection handler, each operating on a separate python thread. Each of these connection handlers has its own device specific data processor which cleans the data and copies it to shared memory. On a third thread, a general data processor combines the separate device data buffers into a single, synthesized data buffer and sends it to the CSV logger. This CSV logger logs the data to a CSV file at intervals determined by the Log Timer. All of these threads are controlled by a main thread which also runs the frontend GUI.
As previously mentioned, we were able to simultaneously complete the physical wiring phase and the backend synthesis/logging phase. This happened early in Winter quarter (January, 2024). In reality, this is a bit of a lie, as we spend the rest of Winter quarter working out bugs in the backend synthesis and logging portion of the program. However, at this point the bare minimum of the Must Haves were complete! This was definitely a major milestone for us and it gave us plenty of motivation to tackle the GUI.
GUI
As we were polishing out the bugs of our backend logging portion of the program, we also began developing a Figma model for the GUI. This is also when/where our teamwork really started to develop. We began to divide up our labor so that we could keep moving ahead while not leaving important aspects behind. Seth focused on cleaning out the backend bugs, Ben took charge on designing and implementing the Figma model, and Eric scouted out the PyQT python library and experimented with ideas and techniques that we would later use to build the GUI.
 Ben’s Figma model of the GUI.
This division of labor continued to the end of Winter quarter, as did the constant iteration and design reconsiderations on all aspects of the project. In fact, at the end of the quarter we made a point to all get on the same page about project expectations and considerations. The MoSCoW prioritization had definitely changed at this point and we wanted it in writing so we didn’t lose track of our goals.
With the Figma model approved by our project partner, we ended Winter quarter by reaching the milestone of getting a basic, proof of concept GUI that displayed the key performance indicator data points in a not so aesthetically pleasing fashion. We took a well deserved spring break to go skiing, play board games, watch movies, and clear our heads before returning to tackle our Should Haves and build the GUI out into something professional.
Spring quarter started with moving our GUI production to PyQT Designer, a GUI building application that makes organizing the layout and aesthetics much easier and more efficient. It allowed us to dial in the look of our application and then export it as a .ui file. The PyQT library includes a tool that converts this .ui file to a .py file that we can then import into our main python program. From there, we manually attach all the buttons and displays to signals from the backend side of the program. We went through this process multiple times per week throughout the quarter as we continually refined its aesthetics. Building the GUI in this way also allowed us to identify many bugs and features that we had not previously considered to be Should Haves and ended up including and adapting our design to them.
KPIs
An important part of the GUI is the display of the key performance indicators (KPIs) of the hydrogen reformer. In addition to logging the data, it was established early on in the project that the GUI should display a live stream of the data points for these KPIs. This (like all things GUI on this project), took many iterations and steps towards refinement. A slightly humorous example of one of these iterations is when demonstrating the current functionality and aesthetics of the GUI to our project partner, it was pointed out that we had the wrong units on the pump and blower speed displays! We really appreciated the weekly iterations at this point.
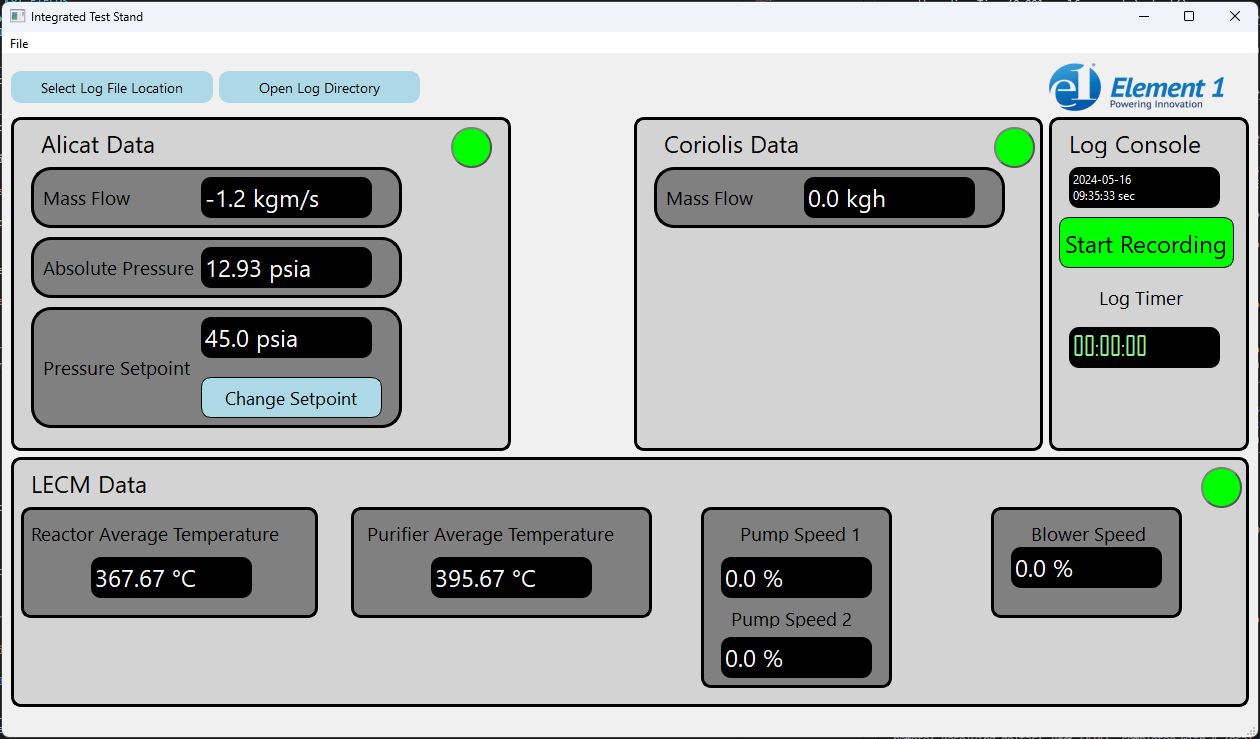
The GUI in all the glory of its final form.
Logging Control
A Must Have that wasn’t explicitly defined at the start of the project but developed alongside our knowledge of the E1’s needs is the fact that the GUI should control the start and stop of the data logging. In addition, the engineers at E1 should be able to select and open the log file directory from the GUI rather than have to hunt for it or know ahead of time where it would be logging to. These features were added and refined during several iterations through Spring quarter. A nice touch that Ben in particular was adamant about including is a color change on the Start/Stop Logging button. When not logging, the button reads “Start Logging” and the green color beckons the engineer to click on it. After logging has been initiated, the text on the button changes to “Stop Logging” and the color changes to red so it can be located with a quick glance.
Device Connections
A Should Have that was not even considered at the start of the project was device connection control via the GUI. However, through the iterative process of attaching the GUI to the backend functionality, we determined that not only would this be a nice touch, it would actually make some of the development easier! Specifically, the program was heavily dependent on a successful TCP connection to the BRX. If the connection was not initially established, or if it disconnected during logging, the program would throw all sorts of errors and the program would often crash. It seemed obvious to us that decoupling this dependency would not only solve our development issues, but make for a better end product. We took it a step further and added device connection “lights” to indicate the connection status, red for not connected, green for connected.
Alicat Control
The ability to set the Alicat setpoint from the GUI seemed to migrate up and down our MoSCoW prioritization list several times throughout the course of this project. Eventually, it landed on the bottom of the Should Haves, but more important than the Could Haves. This particular feature was particularly concerning because both of the two Alicat flow controllers at Element 1 went missing for about 2 months! No, they didn’t get stolen or lost. One of them went to Europe as part of a technology transfer and the other went outside on a different system, both with other partners not involved with OSU or our Capstone project. Luckily, our project partner was able to get one of the Alicats hooked back up to the reformer we were working on a week before we were scheduled to present our project to the public! It was really down to the wire. After putting our heads together, digging up the manuals, and experimenting with different string formats, we were finally able to achieve Alicat setpoint control from the GUI. This concluded all Should Haves.
Results
As of the writing of this blog post, we have completed all Must Haves and all Should Haves of the updated MoSCoW prioritization. The updated list is as follows:
Must Have:
- Synthesized data logging – Complete
- GUI controls start/stop of data logging – Complete
- GUI controls log file directories and names – Complete
Should Have:
- GUI displays live data of key performance indicators (KPIs) – Complete
- GUI is polished and looks professional – Complete
- GUI opens log file directories in Windows Explorer – Complete
- GUI controls device connections – Complete
- LECM connect button doesn’t need to work, but needs indicator – Complete
- BRX should have both connect button and indicator – Complete
- GUI controls Alicat setpoint – Complete
Could Have:
- GUI has embedded view of data logs – Not Started
- GUI displays all live data points (not just KPIs) – Not Started
- GUI displays graphs and/or charts of data – Not Started
Won’t Have:
- Remote access (ability to log in from remote devices)
Compare that to the list at the top of the post and try to tell us that software engineering isn’t an iterative and dynamic process!
Our project partner agrees that completing everything up to the Could Haves is a successful way to hand over the project. With this program, the engineers at Element 1 will now be able to focus on the performance of the hydrogen reformers instead of wrangling different data logs from various locations.
What We Learned
As Computer Science students, we learned a lot from this project. We were given a chance to reinforce many of the concepts that we learned in various classes, and more importantly take those concepts and apply them in a real-world situation. We also got to explore the interface between hardware and software. Not many Computer Science students (or professionals for that matter) get to see how their programs interact with things outside of the computer. By wiring up the devices, building our own network, writing a python program to read and log data from that network, and building a GUI for an engineer to interact with, we really explored the full stack from electrons to eyeballs!
The project also offered us an opportunity to practice and develop our problem solving skills. None of us had any real knowledge of serial communications before attempting to get useful data out of the Alicat. The ladder logic that we used to program the BRX PLC was also new to us and the lack of documentation and support for it out on the internet made it particularly challenging. However, our problem solving was not limited to debugging. By pulling from attitudes and frameworks such as Agile and Scrum, we were able to embrace the iterative design and development process and provide official documentation on top of our software program. All of this was done while navigating around surprise scheduling obstacles and balancing our individual lives.
Indeed, probably the biggest thing we learned from this project is how to effectively work as a team. Working with other peoples’ schedules was just the beginning of it. Understanding each other’s working style and playing to each other's strengths was the crux of it. We all emerged as leaders from this project and are proud of the results.
Home Personal Projects OSU Projects Element 1 Projects Videos
(C) Seth Weiss, 2025